- bubble chart
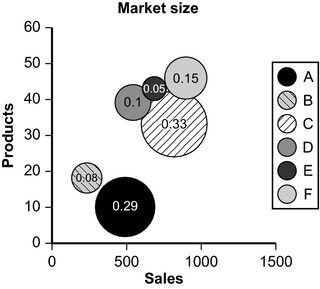
- bubble chart noun [C] GRAPHS & CHARTS► a type of chart in which values and amounts are shown as circles of different sizes and in different places in relation to the axis
Financial and business terms. 2012.
Financial and business terms. 2012.
Bubble Chart — [engl.], Blasengrafik … Universal-Lexikon
bubble chart — burbulinė diagrama statusas T sritis informatika apibrėžtis ↑Taškinė diagrama, kurioje duomuo vaizduojamas jo reikšmę atitinkančio dydžio burbulu. Plačiau žr. priede. priedas( ai) MS Word formatas atitikmenys: angl. bubble chart ryšiai: dar… … Enciklopedinis kompiuterijos žodynas
Chart — For other uses, see Chart (disambiguation) , Graph (disambiguation) , and Diagram For information about charts in Wikipedia, see Wikipedia:Graphs and charts. A pie chart. A chart is a graphical representation of data, in which the … Wikipedia
Chart Show TV — Launched 16 September 2002 Owned by CSC Media Group Picture format 16:9, 576i (SDTV) Audience share 0.1% … Wikipedia
Bubble Hits — Infobox TV channel name = Bubble Hits logofile = Bubble Hits logo.png logoalt = Bubble Hits logo launch = 14 August 2006 share = 0.0% share as of = April 2008 share source = [http://www.barb.co.uk/viewingsummary/monthreports.cfm?report=monthgmulti… … Wikipedia
Bubble Hits Ireland — Infobox TV channel name= Bubble Hits logofile= Bubble Hits logo.png logoal=Bubble Hits logo launch= May 19 2008 owners= Creative Soundsweb= http://www.bubblehits.ie/ www.bubblehits.ie] terr avail=Not Available sat serv 1 = Sky Digital sat chan 1 … Wikipedia
Bubble Trip/Sweet Sweet Song — Infobox Single Name = Bubble Trip / Sweet Sweet Song Artist = Anna Tsuchiya from Album = B side = Released = August 1, 2007 Format = CD, DVD Recorded = 2007 Genre = |R B, Japanese pop, Rock, Pop rock Length = Label = Avex Trax Writer = Producer … Wikipedia
Motion chart — An example of a Motion Chart illustrating the relationships between six variables. A motion chart is a dynamic Bubble chart which allows efficient and interactive exploration and visualization of longitudinal multivariate Data.[1] Motion Charts… … Wikipedia
Ragone chart — is a bubble chart used for performance comparison of various energy storing devices. On such a chart the values of energy density (in Wh/kg) are plotted versus power density (in W/kg). Both axes are logarithmic, which allows comparing performance … Wikipedia
Chinese property bubble — An empty corridor in the mostly vacant New South China Mall. The Chinese property bubble is an alleged ongoing real estate bubble in residential and/or commercial real estate in the People s Republic of China. The phenomenon has seen average… … Wikipedia